-
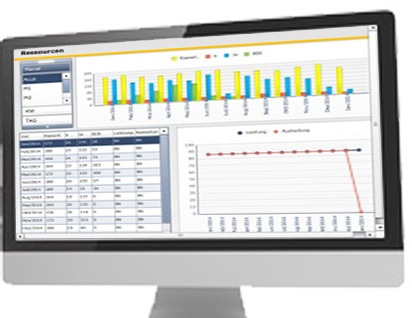
Productivity
is a decisive competitive advantage which should be constantly maintained. The design of your production process organisation has to be constantly analysed to evaluate the status quo.
-
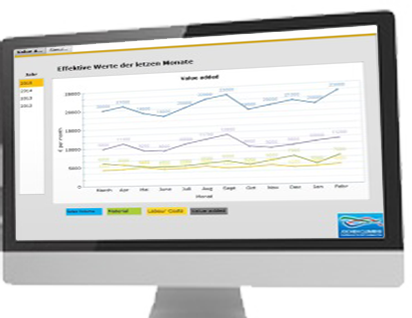
Value Added
shows you which products earn you money. References to planned and effectively used production times show you which products best cover production costs.
-
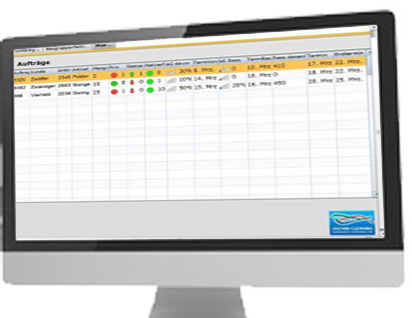
Costs
have to be identified before they can be influenced. Together with costing, we compile all the data that you need. Orders, product costs, cost centres.

Performance Management stands for
-
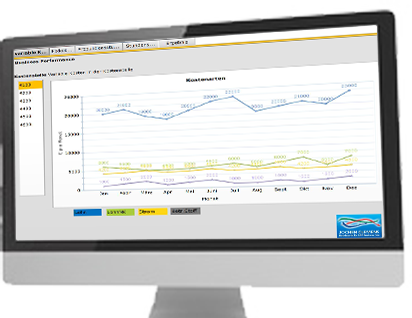
Cost Management provides a basis for
Profitability Analysis, Cost Rates, Overhead Application Rates, Calculation
-
Yield Management shows you
Profit of products/product groups and overhead/direct costs of your products
-
Logistics Controlling shows you
Trends, Variances of Efficiency, Cycle time, Delivery Dates